2012 United States presidential election in California Turnout 72.36% (of registered voters) pp pp [ 1]
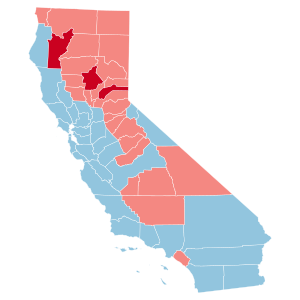
County results Congressional district results
Obama
40–50%
50–60%
60–70%
70–80%
80–90%
90-100%
Romney
50–60%
60–70%
The 2012 United States presidential election in California took place on November 6, 2012, as part of the 2012 United States presidential election in which all 50 states plus the District of Columbia participated. California voters chose 55 electors, the most out of any state, to represent them in the Electoral College via a popular vote pitting incumbent Democratic President Barack Obama and his running mate, Vice President Joe Biden , against Republican challenger and former Massachusetts Governor Mitt Romney and his running mate, Congressman Paul Ryan .
Prior to the election, every major news network considered California to be a state Obama would win or a safe blue state . According to Secretary of State Debra Bowen's website, the President won the popular vote with 60.24%, with Mitt Romney in second place at 37.12%, and Libertarian candidate Gary Johnson in third at 1.10%.[ 2] George H. W. Bush won the state in 1988 .
As of the 2024 presidential election , this is the last presidential election in which the nominee from the Republican Party won Orange County —a longtime, traditional bastion for the national GOP—and Nevada County . With its 55 electoral votes, California was Obama's largest electoral prize in 2012.
2012 California Democratic presidential primary
Candidate
Barack Obama
Home state
Illinois
Delegate count
547
Popular vote
2,075,905
Percentage
100%
California results by county
Barack Obama
The 2012 California Democratic presidential primary took place on June 5, 2012, as part of the 2012 Democratic Party presidential primaries .
2012 California Democratic presidential primary[ 3] [ 4]
Candidate
Popular vote
%
Delegates
Barack Obama (incumbent)2,075,905
100%
547.0
Darcy Richardson (write-in)
221
0.00%
0.0
Michael W.R. Meyer, Jr. (write-in)
129
0.00%
0.0
Louis Alberto Ramos, Jr. (write-in)
54
0.00%
0.0
Uncommitted
—
62.0
Total
2,076,309
100%
609
2012 California Republican presidential primary
California results by county
Mitt Romney
(Note:
Italicization indicates a withdrawn candidacy)
The 2012 California Republican Party presidential primary took place on June 5, 2012, as part of the 2012 Republican Party presidential primaries .[ 5] [ 6] [ 7] 2012 Republican National Convention .
As noted in the Green Papers for California, "159 district delegates are to be bound to presidential contenders based on the primary results in each of the 53 congressional districts: each congressional district is assigned 3 National Convention delegates and the presidential contender receiving the greatest number of votes in that district will receive all 3 of that district's National Convention delegates. 10 at-large delegates (10 base at-large delegates plus 0 bonus delegate) are to be bound to the presidential contender receiving the greatest number of votes in the primary statewide. In addition, 3 party leaders, the National Committeeman, the National Committeewoman, and the chairman of the California's Republican Party, will attend the convention as unpledged delegates by virtue of their position."[ 7]
2012 California Republican presidential primary[ 3] [ 7]
Candidate
Popular vote
%
Delegates
Mitt Romney 1,530,513
79.51%
169
Ron Paul
199,246
10.35%
0
Rick Santorum (withdrawn)
102,258
5.31%
0
Newt Gingrich (withdrawn)
72,022
3.74%
0
Charles E. "Buddy" Roemer, III (withdrawn)
12,520
0.65%
0
Fred Karger
8,393
0.44%
0
Jeremy Hannon (write-in)
11
0.00%
0
Donald James Gonzales (write-in)
5
0.00%
0
Sheldon Yeu Howard (write-in)
2
0.00%
0
Uncommitted
—
3
Total
1,924,970
100%
172
2012 California Green Party presidential primary
The 2012 California Green Party presidential primary took place on June 5, 2012, as part of the 2012 Green Party presidential primaries .
Green Party of California presidential primary, June 5, 2012[ 3] [ 8]
Candidate
Votes
Percentage
National delegates
Jill Stein 9,165
49.36%
35
Roseanne Barr
7,399
39.85%
26
Kent Meslplay
2,005
10.80%
7
Total
18,569
100%
68
Libertarian primary [ edit ] 2012 California Libertarian Party presidential primary
Candidate
Gary Johnson Barbara Joy Waymire
Scott Keller
Home state
New Mexico
Popular vote
6,780
2,118
1,208
Percentage
49.98%
15.61
8.91%
The 2012 California Libertarian Party presidential primary took place on June 5, 2012, as part of the 2012 Libertarian Party presidential primaries .
The primary was non-binding, and took place after Gary Johnson had already won the Libertarian nomination at the Party's 2012 convention .
California Libertarian presidential primary, June 5, 2012[ 3]
Candidate
Votes
Percentage
Gary Johnson 6,780
50.0%
Barbara Joy Waymire
2,118
15.6%
Scott Keller
1,208
8.9%
R. J. Harris
670
4.9%
Bill Still
670
4.9%
Roger Gary
559
4.1%
James Ogle
558
4.1%
Carl Person
523
3.9%
Lee Wrights
479
3.5%
Total
13,565
100%
American Independent [ edit ] The American Independent Party , a far-right and paleoconservative political party that formed when endorsing the candidacy of George Wallace in 1968 held a small presidential primary on June 5. It was won by Edward C. Noonan . However, the party would instead opt to nominate Tom Hoefling for president.
California American Independent presidential primary, June 5, 2012[ 3]
Candidate
Votes
Percentage
Edward C. Noonan 16,926
38.7%
Laurie Roth
16,326
37.4%
Mad Max Riekse
10,430
23.9%
Raymond Delmond Smith (write-in)
6
0.0%
Andrew Abe Diaz (write-in)
4
0.0%
Total
43,692
100%
California Peace and Freedom presidential primary, June 5, 2012[ 3]
Candidate
Votes
Percentage
Ross C. "Rocky" Anderson 1,589
43.4%
Stewart Alexander
1,094
29.9%
Stephen Durham
971
26.5%
Shelley Upchurch (write-in)
4
0.1%
Ronald Clinton Forbes (write-in)
2
0.1%
Leon Leo Ray (write-in)
2
0.1%
Total
3,662
100%
Candidate ballot access [ edit ] Mitt Romney/Paul Ryan, Republican
Barack Obama/Joseph Biden, Democratic
Gary Johnson/James P. Gray, Libertarian
Jill Stein/Cheri Honkala, Green
Tom Hoefling/Robert Ornelas, Independent
Roseanne Barr/Cindy Sheehan, Peace and Freedom Write-In Candidate Access:
Virgil Goode/Jim Clymer, Constitution
Rocky Anderson/Luis J. Rodriguez, Justice
James Harris/Maura DeLuca, Socialist Workers
Stewart Alexander/Alejandro Mendoza, Socialist
Jerry White/Phyllis Scherrer, Socialist Equality
Stephen Durham/Christina Lopez, Freedom Socialist
Ron Paul/Andrew Napolitano[ 9]
2012 United States presidential election in California[ 17]
Party
Candidate
Running mate
Votes
Percentage
Electoral votes
Democratic Barack Hussein Obama (incumbent)
Joseph Robinette Biden Jr. (incumbent)
7,854,285
60.24%
55
Republican
Willard Mitt Romney
Paul Davis Ryan
4,839,958
37.12%
0
Libertarian
Gary Johnson
Jim Gray
143,221
1.10%
0
Green
Jill Stein
Cheri Honkala
85,638
0.66%
0
Peace and Freedom
Roseanne Barr
Cindy Sheehan
53,824
0.41%
0
American Independent
Thomas Hoefling
Robert Ornelas
38,372
0.29%
0
Independent
Ron Paul (write-in )
Andrew Napolitano
21,461
0.16%
0
Independent
Rocky Anderson (write-in)
Luis Rodriguez
992
0.01%
0
Independent
Virgil Goode (write-in)
Jim Clymer
503
0.00%
0
Independent
Stewart Alexander (write-in)
Alejandro Mendoza
82
0.00%
0
Independent
Jerry White (write-in)
Phyllis Scherrer
79
0.00%
0
Independent
James Harris (write-in)
Maura DeLuca
72
0.00%
0
Independent
Stephen Durham (write-in)
Christina López
54
0.00%
0
Independent
Sheila Tittle (write-in)
Matthew Turner
6
0.00%
0
Valid votes
13,038,547
98.76%
—
Invalid or blank votes
163,611
1.24%
—
Totals
13,202,158
100.00%
55
Voter turnout
72.35%
—
County
Barack Obama
Mitt Romney
Various candidates
Margin
Total votes cast
#
%
#
%
#
%
#
%
Alameda
469,684
78.69%
108,182
18.12%
19,027
3.19%
361,502
60.57%
596,893
Alpine
389
59.48%
236
36.09%
29
4.43%
153
23.39%
654
Amador
6,830
38.60%
10,281
58.11%
582
3.29%
-3,451
-19.51%
17,693
Butte
42,669
46.88%
44,479
48.87%
3,873
4.25%
-1,810
-1.99%
91,021
Calaveras
8,670
39.66%
12,365
56.56%
827
3.78%
-3,695
-16.90%
21,862
Colusa
2,314
38.28%
3,601
59.57%
130
2.15%
-1,287
-21.29%
6,045
Contra Costa
290,824
66.23%
136,517
31.09%
11,804
2.68%
154,307
35.14%
439,145
Del Norte
3,791
43.23%
4,614
52.61%
365
4.16%
-823
-9.38%
8,770
El Dorado
35,166
39.51%
50,973
57.27%
2,859
3.22%
-15,807
-17.76%
88,998
Fresno
129,129
49.72%
124,490
47.94%
6,078
2.34%
4,639
1.78%
259,697
Glenn
3,301
35.73%
5,632
60.97%
305
3.30%
-2,331
-25.24%
9,238
Humboldt
34,457
59.73%
18,825
32.63%
4,404
7.64%
15,632
27.10%
57,686
Imperial
25,136
65.18%
12,777
33.13%
652
1.69%
12,359
32.05%
38,565
Inyo
3,422
42.58%
4,340
54.01%
274
3.41%
-918
-11.43%
8,036
Kern
89,495
40.28%
126,618
56.99%
6,076
2.73%
-37,123
-16.71%
222,189
Kings
12,979
41.31%
17,671
56.24%
768
2.45%
-4,692
-14.93%
31,418
Lake
13,163
56.27%
9,200
39.33%
1,028
4.40%
3,963
16.94%
23,391
Lassen
3,053
28.47%
7,296
68.03%
376
3.50%
-4,243
-39.56%
10,725
Los Angeles
2,216,903
69.69%
885,333
27.83%
78,831
2.48%
1,331,570
41.86%
3,181,067
Madera
16,018
40.11%
22,852
57.23%
1,063
2.66%
-6,834
-17.12%
39,933
Marin
99,896
74.14%
30,880
22.92%
3,955
2.94%
69,016
51.22%
134,731
Mariposa
3,498
38.70%
5,140
56.87%
400
4.43%
-1,642
-18.17%
9,038
Mendocino
23,193
66.01%
9,658
27.49%
2,286
6.50%
13,535
38.52%
35,137
Merced
33,005
53.04%
27,581
44.33%
1,636
2.63%
5,424
8.71%
62,222
Modoc
1,111
27.64%
2,777
69.10%
131
3.26%
-1,666
-41.46%
4,019
Mono
2,733
52.75%
2,285
44.10%
163
3.15%
448
8.65%
5,181
Monterey
82,920
67.13%
37,390
30.27%
3,208
2.60%
45,530
36.86%
123,518
Napa
35,870
62.97%
19,526
34.28%
1,572
2.75%
16,344
28.69%
56,968
Nevada
24,663
47.73%
24,986
48.35%
2,027
3.92%
-323
-0.62%
51,676
Orange
512,440
45.65%
582,332
51.87%
27,892
2.48%
-69,892
-6.22%
1,122,664
Placer
66,818
38.91%
99,921
58.19%
4,972
2.90%
-33,103
-19.28%
171,711
Plumas
4,026
39.94%
5,721
56.76%
333
3.30%
-1,695
-16.82%
10,080
Riverside
329,063
49.62%
318,127
47.97%
15,926
2.41%
10,936
1.65%
663,116
Sacramento
300,503
58.06%
202,514
39.13%
14,565
2.81%
97,989
18.93%
517,582
San Benito
11,276
59.10%
7,343
38.48%
462
2.42%
3,933
20.62%
19,081
San Bernardino
305,109
52.34%
262,358
45.01%
15,463
2.65%
42,751
7.33%
582,930
San Diego
626,957
52.51%
536,726
44.95%
30,266
2.54%
90,231
7.56%
1,193,949
San Francisco
301,723
83.40%
47,076
13.01%
12,996
3.59%
254,647
70.39%
361,795
San Joaquin
114,121
55.57%
86,071
41.91%
5,172
2.52%
28,050
13.66%
205,364
San Luis Obispo
61,258
48.63%
59,967
47.61%
4,741
3.76%
1,291
1.02%
125,966
San Mateo
206,085
72.13%
72,756
25.46%
6,879
2.41%
133,329
46.67%
285,720
Santa Barbara
94,129
57.44%
64,606
39.42%
5,150
3.14%
29,523
18.02%
163,885
Santa Clara
450,818
69.97%
174,843
27.14%
18,616
2.89%
275,975
42.83%
644,277
Santa Cruz
90,805
75.43%
24,047
19.98%
5,533
4.59%
66,758
55.45%
120,385
Shasta
25,819
33.75%
48,067
62.83%
2,615
3.42%
-22,248
-29.08%
76,501
Sierra
653
36.30%
1,056
58.70%
90
5.00%
-403
-22.40%
1,799
Siskiyou
8,046
40.24%
11,077
55.40%
870
4.36%
-3,031
-15.16%
19,993
Solano
96,783
63.32%
52,092
34.08%
3,965
2.60%
44,691
29.24%
152,840
Sonoma
153,942
70.99%
54,784
25.26%
8,139
3.75%
99,158
45.73%
216,865
Stanislaus
77,724
49.88%
73,459
47.14%
4,633
2.98%
4,265
2.74%
155,816
Sutter
12,192
39.22%
18,122
58.30%
769
2.48%
-5,930
-19.08%
31,083
Tehama
7,934
34.53%
14,235
61.95%
808
3.52%
-6,301
-27.42%
22,977
Trinity
2,674
46.59%
2,716
47.33%
349
6.08%
-42
-0.74%
5,739
Tulare
41,752
41.22%
56,956
56.24%
2,571
2.54%
-15,204
-15.02%
101,279
Tuolumne
9,998
40.38%
13,880
56.06%
880
3.56%
-3,882
-15.68%
24,758
Ventura
170,929
52.16%
147,958
45.15%
8,825
2.69%
22,971
7.01%
327,712
Yolo
48,715
65.24%
23,368
31.29%
2,588
3.47%
25,347
33.95%
74,671
Yuba
7,711
39.02%
11,275
57.06%
775
3.92%
-3,564
-18.04%
19,761
Total
7,854,285
60.16%
4,839,958
37.07%
361,572
2.77%
3,014,327
23.09%
13,055,815
Shift by county Trend by county
Democratic — +5−7.5%
Democratic — +2.5−5%
Democratic — +0−2.5%
Republican — +0−2.5%
Republican — +2.5−5%
Republican — +5−7.5%
Republican — +7.5-10%
County flips
Democratic
Hold
Gain from Republican
Republican
Hold
Counties that flipped from Democratic to Republican Official outcomes by city.[ 18]
By congressional district [ edit ] Obama won 41 of the 53 congressional districts, including 3 held by Republicans.[ 19]
^ "Historical Voter Registration and Participation in Statewide General Elections 1910-2018" (PDF) . California Secretary of State . Retrieved May 5, 2022 .^ "President - Statewide Results | General Election | California Secretary of State" . Archived from the original on November 8, 2012. Retrieved November 7, 2012 .^ a b c d e f "Statement of Vote June 5, 2012 Presidential Primary Election" (PDF) . California Secretary of State. Retrieved May 17, 2021 .^ "California Democratic Delegation 2012" . www.thegreenpapers.com . Retrieved May 17, 2021 .^ "Primary and Caucus Printable Calendar" . CNN . Retrieved January 11, 2012 .^ "Presidential Primary Dates" (PDF) . Federal Election Commission . Retrieved January 23, 2012 .^ a b c "California Republican Delegation 2012" . www.thegreenpapers.com . Retrieved May 17, 2021 .^ "2012 President Green-rainbow Primary" . June 5, 2012.^ "California Secretary of State Certified List of Write-In Candidates" (PDF) . Archived from the original (PDF) on November 19, 2012. Retrieved November 20, 2012 .^ "Huffington Post Election Dashboard" . HuffPost the original on August 13, 2013.^ "America's Choice 2012 Election Center: CNN Electoral Map" . CNN the original on January 19, 2013.^ "Election 2012 - The Electoral Map: Building a Path to Victory" . The New York Times the original on July 8, 2012.^ "2012 Presidential Election Results" The Washington Post . Archived from the original on July 26, 2012.^ "RealClearPolitics - 2012 Election Maps - Battle for White House" . Archived from the original on June 8, 2011.^ "PROJECTION: OBAMA WILL LIKELY WIN SECOND TERM" .^ "Nate Silver's political calculations predict 2012 election outcome" .^ "Statement of Vote: November 6, 2012 General Election" (PDF) . California Secretary of State . December 18, 2012. Archived from the original (PDF) on December 24, 2012. Retrieved January 2, 2013 .^ "Supplement to Statement of Vote" (PDF) . California Secretary of State. Retrieved December 11, 2020 .^ "Daily Kos Elections' statewide election results by congressional and legislative districts" . Daily Kos . Retrieved August 11, 2020 .
U.S. U.S. U.S. (Election ) Governors Attorneys Other State
Alaska
Arizona
California
Connecticut
Delaware
Florida
Hawaii
Illinois
Iowa
Michigan
Minnesota
Montana
New Mexico
New York
North Carolina
Oregon
Pennsylvania
Texas
Washington
Wisconsin
Wyoming
Mayoral
Alexandria, VA Anchorage, AK Augusta, GA Austin, TX Bakersfield, CA Baton Rouge, LA Cheyenne, WY Corpus Christi, TX Fort Lauderdale, FL Fresno, CA Glendale, AZ Honolulu, HI Huntsville, AL Irvine, CA Juneau, AK Lubbock, TX Mesa, AZ Miami-Dade County, FL Milwaukee, WI Orlando, FL Portland, OR Richmond, VA Riverside, CA Sacramento, CA San Diego, CA San Juan, PR Santa Ana, CA Stockton, CA Virginia Beach, VA Wilmington, DE States and
Democratic Party
Republican Party
Libertarian Party
Green Party
Election timelines National opinion polling State opinion polling Fundraising Debates and forums Straw polls Major events Caucuses primaries
Results breakdown National
Reforms


